Tracking Your Carbon Emissions
DeltaGrid® EM Carbon Emission Reduction Solution
To move towards the goal of Net Zero, multinational companies, as well as Delta, have joined the RE100 initiative and promised to use 100% renewable energy and achieve carbon neutrality.
Besides their own efforts, companies have also require the supply chain to assume environmental sustainability responsibilities, and develop solutions to carbon taxes. Among them, the first task is to track the amount of carbon emissions, and then to implement energy saving and carbon reduction.
Local Supervisory
Authorities of Your Factories
Your Customers
in the Supply Chain
Governments of
Your Target Markets
= Electricity Usage x Emission Factor +Employee Headcount x Fossil CO2 per Capita
Calculation Formula
* Total Carbon Emissions = annual electricity usage x emission factor by country/region + employee headcount x fossil CO2 per capita by country/region
* Estimated Carbon Tax = total carbon emissions x $10 per tCO2e
References and Source
* Emission Factor: 2020 Grid Electricity Emissions Factors v1.4 – September 2020
* Fossil CO2 per capita : Fossil CO2 emissions of all world countries, 2020 report
* Carbon tax varies from place to place. This calculator uses an average price of US$10 as the calculation basis.
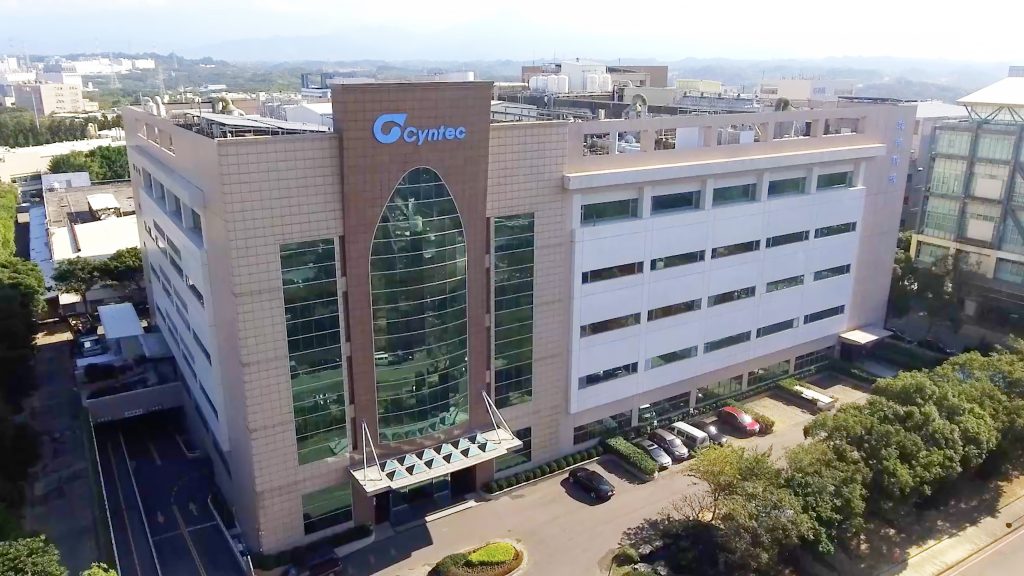
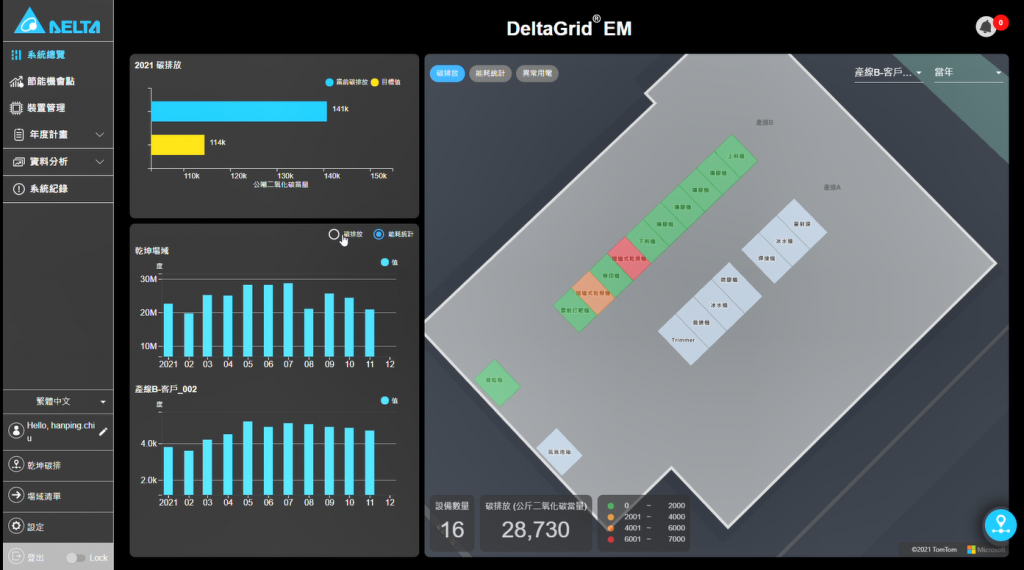
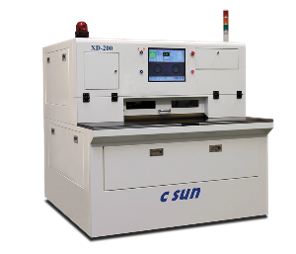
Cyntec, a Delta Group Company, owns a laser welding production line which consists of several automated equipment and is put into production 24 hours a day. After introducing the DeltaGrid EM carbon emission tracking solution, its plant managers can start to visualize and provide carbon emissions information to their customers and supply chain.
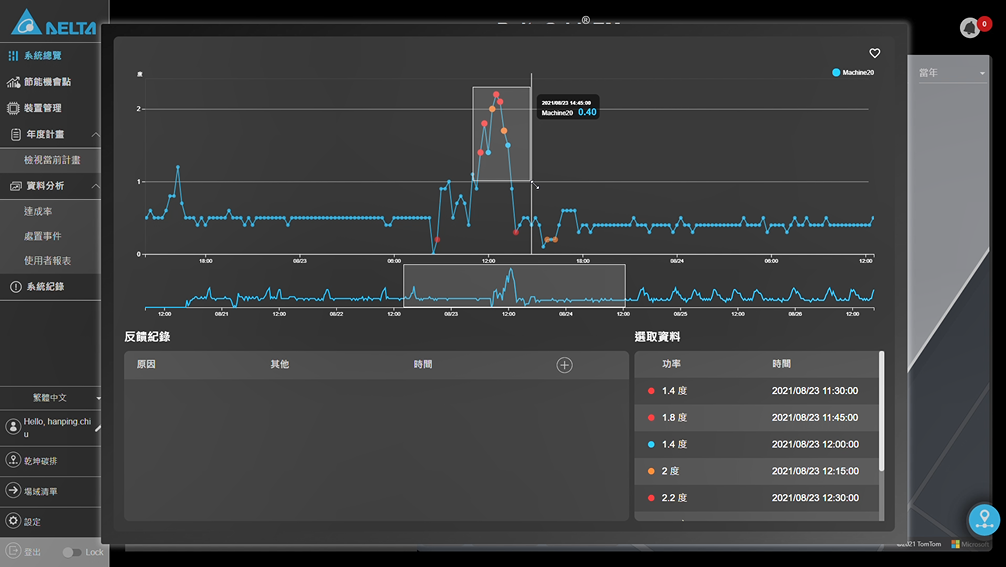
With DeltaGrid® EM solution, abnormal power consumption can be captured, and actionable energy-saving opportunities can be identified as the target of optimization. When big data continues to accumulate, in the future, Cyntec will better train the AI system to detect abnormal accurately, and leverage it to set carbon reduction targets to achieve its goal of reducing carbon emissions.

Carbon emissions
tracking refine to product or
production line level
Data visualization for
instant insight on
abnormal energy usage
Yearly/Quarterly/Monthly
reduction goal setting for plant
or production line